Collaboration is central to water research at Utah State University, and the USU Water Initiative provides a forum for USU researchers to make a difference—together. The collegial interdisciplinary community of water scholars at USU engaged in water education, research and outreach includes academic departments, centers, and labs in six colleges.
Partners
USU departments and centers contributing to Water Research at USU, listed alphabetically:
Spring Runoff Conference
The USU Spring Runoff Conference is held annually to provide a forum for interdisciplinary sharing and exchange of ideas on water-related issues in Utah and the Intermountain Region extending to all aspects of water science, ecology, policy, engineering, and management. The Conference is held each March at the USU Eccles Conference Center on the Logan campus. Registration and abstract submissions are accepted starting in mid-January.
Water Research in the News
Find more Water Research News at Utah State Today.
Utah State Today | March 21, 2024
Cache Water Users and Utah State University have combined two annual water conferences into one event, the Northern Utah Water Users/Spring Runoff Conference, on March 26 and 27.
Utah State Today | March 15, 2024
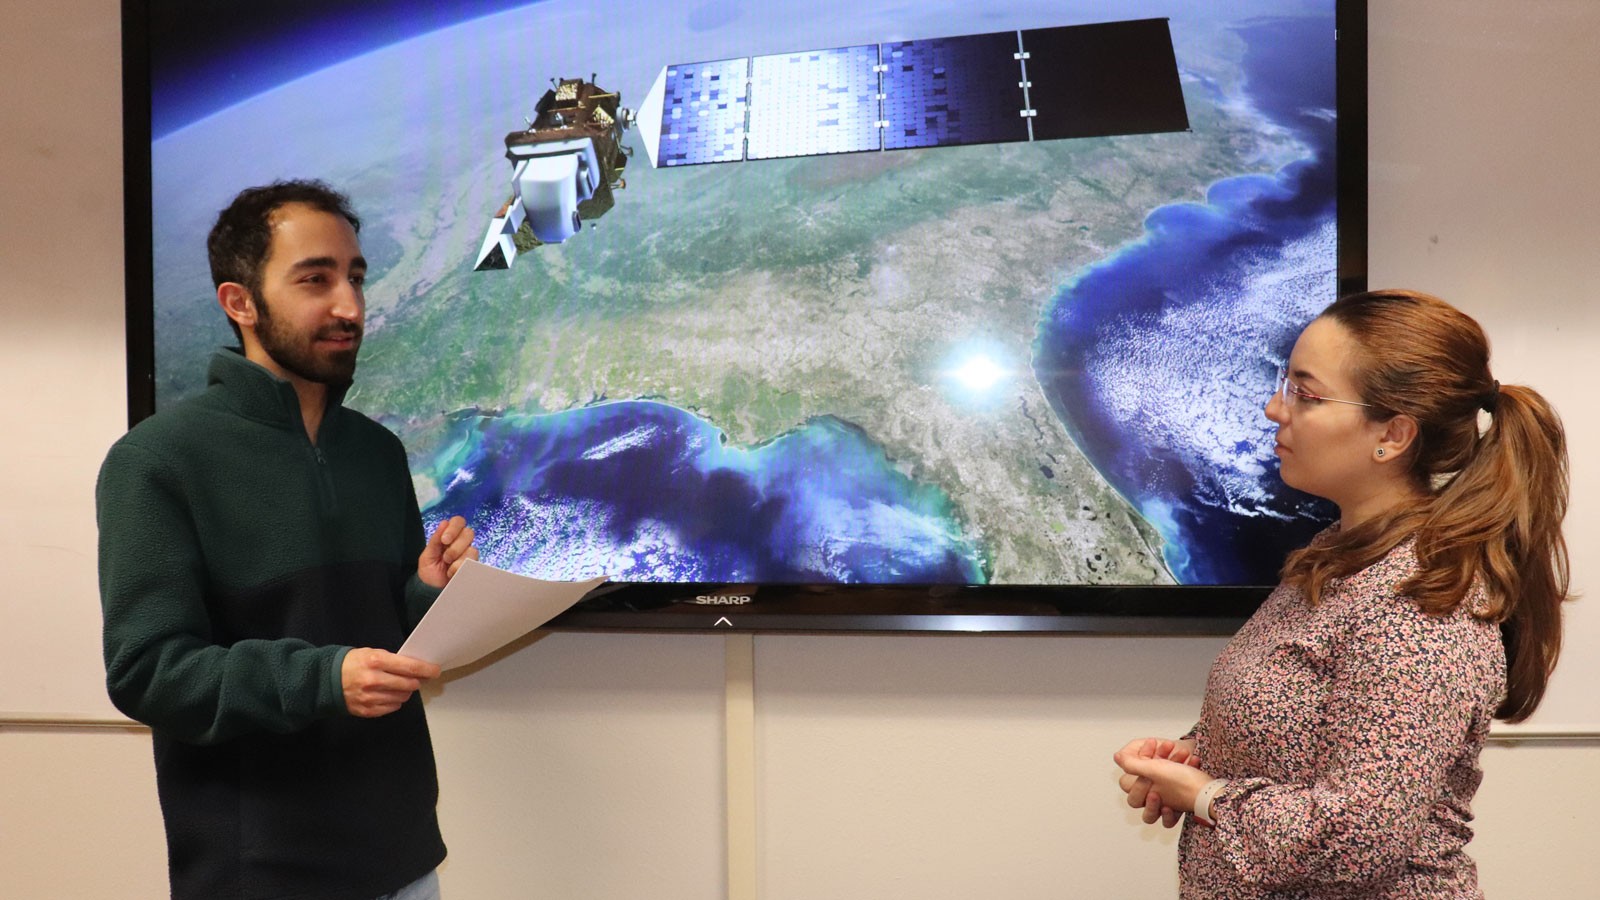
Pursuing NSF-funded research, Soukaina Filali Boubrahimi, Pouya Hosseinzadeh and colleagues publish findings in AGU's 'Water Resources Research' journal.
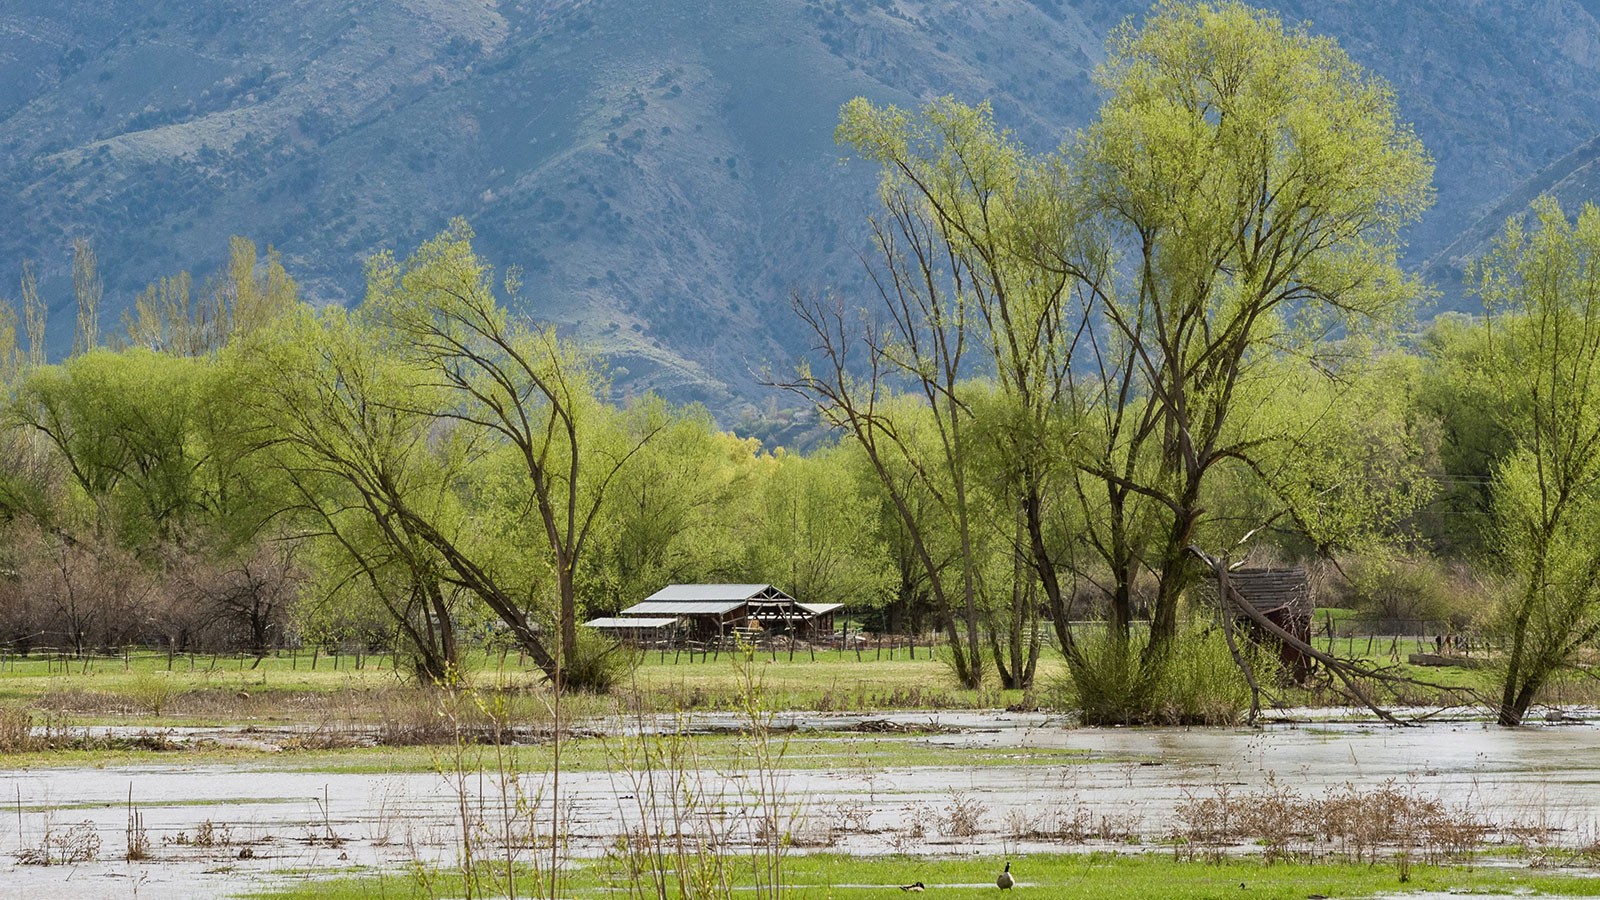
Climate science doctoral candidate Matthew LaPlante, with help from faculty members Luthiene Dalanhese and S-Y Simon Wang, investigated whether tropical ocean sea surface temperatures predicted the precipitation anomaly that hit the state in force.
Mission & History
The USU Water Initiative provides an overarching umbrella for the activities of the water community aimed at fostering interdisciplinary collaboration and collegial sharing of ideas related to water across the departments and colleges of Utah State University. Water related seminars in a number of colleges and departments occur on a regular basis.
The USU Water Initiative emerged from a task force appointed by University President Kermit Hall in Fall 2002 charged with recommending ways to strengthen water programs at USU that take advantage of the diversity and breadth of water activities at USU. The task force initiated a number of collaborative activities that advanced water strengths at USU and persist in the research and education activities of Water Initiative Partners, and the Spring Runoff Conference.